Quick Start Guide
By the end of this section you’ll be able to load data, create a dashboard, and analyze your data, all from scratch.
Create an account
Begin by Creating an Account. Once you’ve logged in, take a quick tour of the left Nav Bar to familiarize yourself with the platform.

The main entry point to get started is on the dashboards page. Clicking on Dashboards will bring you to this view and you’ll be ready to create your first dashboard.
Create your first dashboard
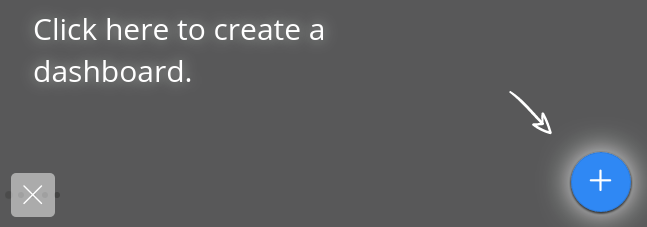
To create a dashboard, click on the blue plus sign.
Note
Keep an eye out for the blue plus sign on other pages. This indicates that you can create new content from that space.
Creating a blank dashboard
To create a brand new dashboard, you can start from scratch by clicking on “Blank Dashboard”.
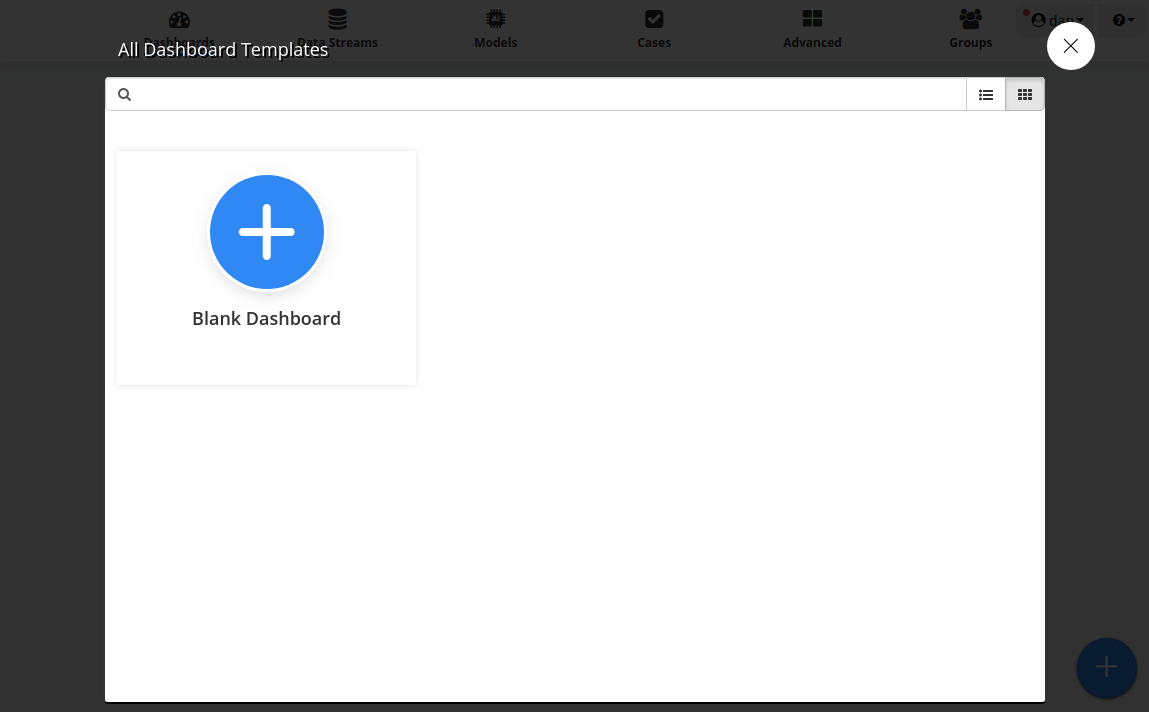
The next two sections cover how to bring data into your new dashboard and create visualizations.
Starting from a template
The template library has a variety of pre-built dashboards to use as a starting point. The data source you plan on using should match the one already in the template.

Once you’ve selected a template, you’ll see the original dataset and be given the option to replace it with a new dataset.
Note
The new dataset must have the same fields as the original dataset in order for the template visualizations to automatically populate.
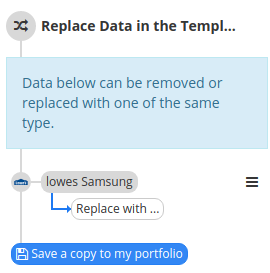
The new data will begin processing and will automatically populate the visualizations once finished.
Save the dashboard to your portfolio and you have successfully created a new dashboard from a template.
You can also turn your custom dashboards into a template from the dashboard properties menu.
Connect to data
Next, you can replace the data in your template with the data you’d like to analyze by clicking replace data, or you can start importing new data sources by clicking on import data.
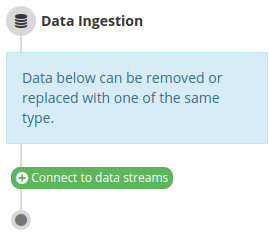
Select an existing dataset or start with a new dataset.
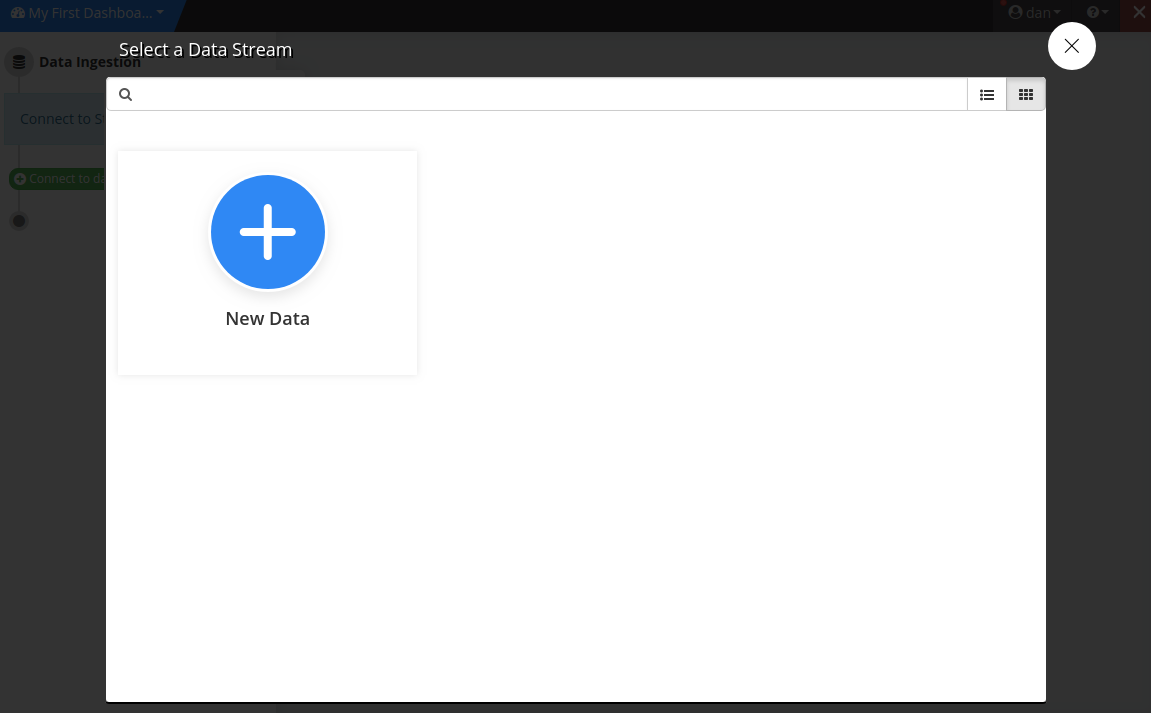
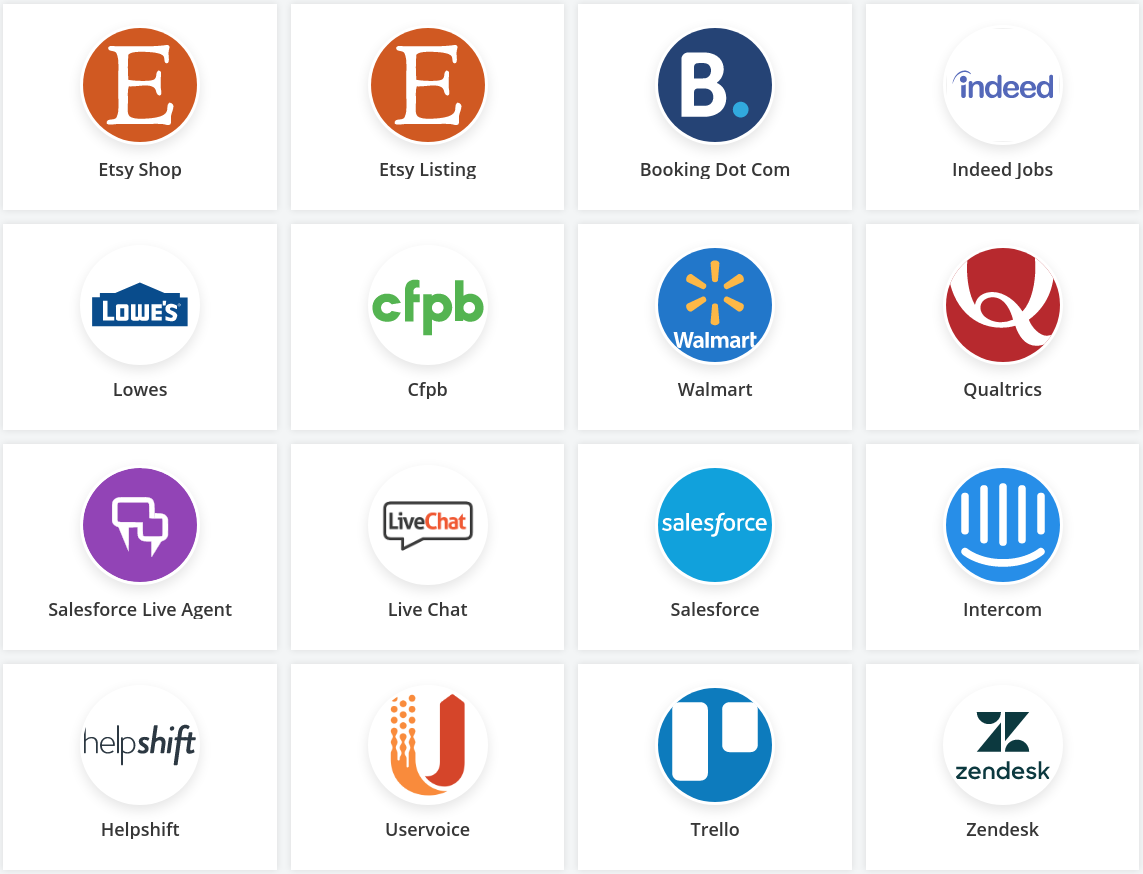
Connect to your database, upload a CSV or Excel file, or use one of our Data Connectors for easy access to a wealth of publicly available data. Add as many data source to your dashboard as needed.
If you’re bringing your own data, specify which fields contain Textual, Temporal, or Geographical information for analysis and normalization. All other fields will be brought in as pivot points and additional visualizations.

Note
See the Mapping Data guide for more details when uploading CSV or Excel Files
Create visualizations
Your dashboard will contain visualizations based on the type of data in your analysis by default. See the guide on Processing Data for information on how to interpret these visualizations. Every visualization is clickable, and clicking will apply a filter on your data based on your selection.
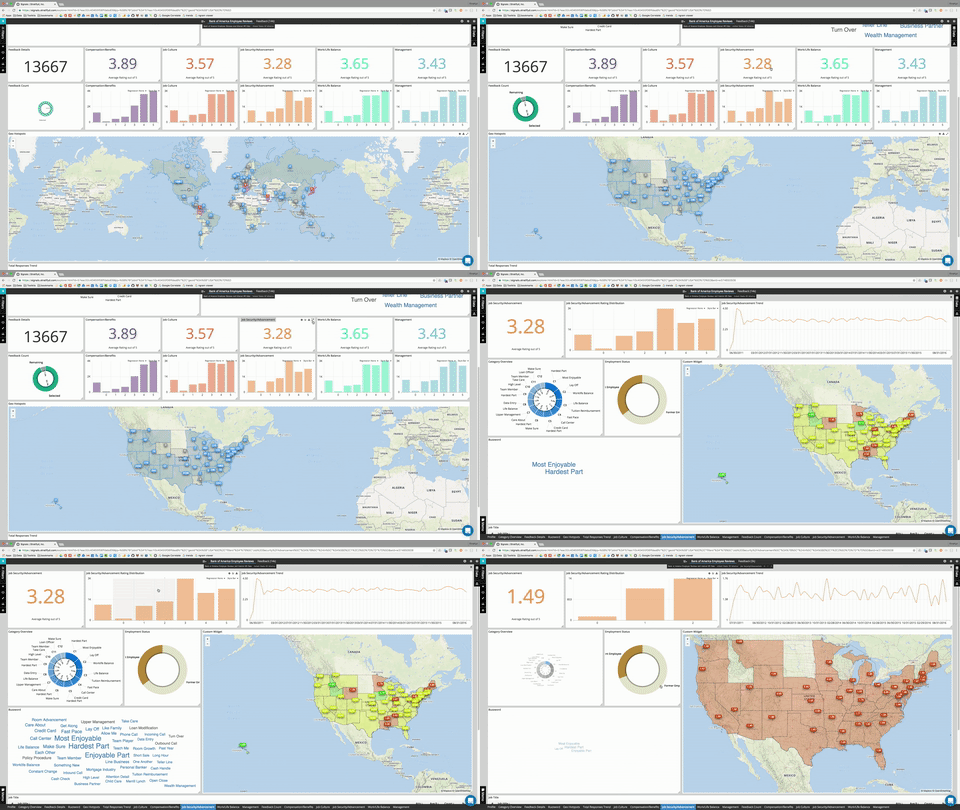
Now you’re ready to Create Your Own Widgets using your other datapoints to home in on interesting segments within your data and discover topics and themes within your textual data.
Find meaningful insights
Let the visualizations guide your analysis. Click on areas of interest to drill-down into subsets of data
Click on the “Data” tab to view the original documents. If you’ve filtered down to a subset of your data in your dashboard, you’ll see only those documents.
For more information see the chapter on Analyzing Data.